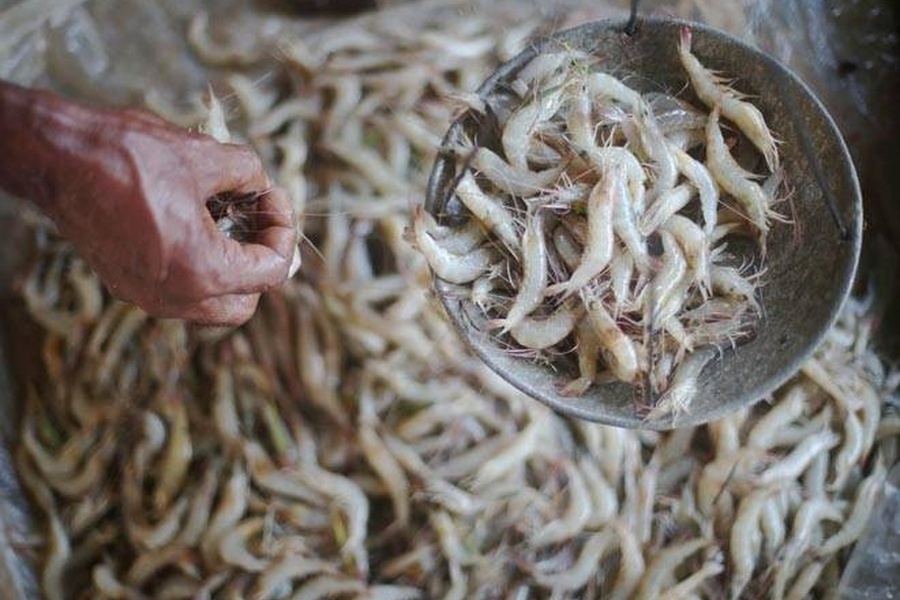
Thailand enhances export processed shrimp to US and Japan.
- 15:25 Ngày 27 tháng 4 năm 2018
- 108 Lượt xem
According to Thai frozen foods association (TFFA), in January, shrimp export of this country decreased by 9.78% in comparison with the same period of the last year. Meanwhile, export to main markets as US, Japan, S. Korea and EU also declined 15.6%, 0.3%, 6.1% and 20.6% respectively.
According to statistics of Trademap, in 2017, Thai total export turnover in value reached 1.98 billion USD, reducing by 2.95% compared to 2016.
In 2017, to meet high demand in Tawain, Thai processers improved import shrimp from foreign countries. Shrimp import from Argentina and India climbed up 28% and 41.6% respectively.
.jpg)
Interestingly, shrimp import from Myanmar in volunme increased suddenly by 716% while this figure from Malaysia rocketed to 5.900% over the last year.
According to new statistics of TFFA, in January 2018, Thailand countinuously enhanced export to US, Japan and Vietnam. In which, US is the most important market of Thai shrimp’s product, accounting for 32.2% in total.
Frozen shrimp (HS 030617) occupied the largest share by 44.6% total shrimp export of Thai. Additionally, export of processed shrimp’s products (HS 160521) and processed shrimp (HS 160529) to US and Japan markets also increased in the first months 2018.
|
Shrimp export of Thai 2016 - 2017 (Thousand USD) |
||||||||
|
|
Thị trường |
Q1 |
Q2 |
Q3 |
Q4 |
2017 |
2016 |
Growth rate |
|
1 |
US |
140.886 |
201.531 |
266.598 |
220.651 |
829.666 |
837.870 |
-0,98 |
|
2 |
Japan |
120.246 |
111.733 |
112.360 |
109.477 |
453.816 |
446.838 |
1,56 |
|
3 |
Viet Nam |
20.460 |
36.697 |
29.371 |
39.855 |
126.383 |
134.924 |
-6,33 |
|
4 |
Canada |
13.782 |
22.898 |
35.393 |
25.552 |
97.625 |
114.040 |
-14,39 |
|
5 |
Australia |
14.672 |
17.855 |
21.458 |
24.336 |
78.321 |
69.374 |
12,90 |
|
6 |
S. Korea |
17.917 |
21.613 |
18.717 |
17.434 |
75.681 |
61.080 |
23,90 |
|
7 |
China |
11.280 |
24.576 |
12.699 |
13.066 |
61.621 |
82.991 |
-25,75 |
|
8 |
Taiwan |
5.489 |
13.702 |
19.881 |
16.679 |
55.751 |
27.084 |
105,84 |
|
9 |
UK |
11.641 |
12.238 |
14.445 |
11.173 |
49.497 |
62.910 |
-21,32 |
|
10 |
Germany |
4.162 |
2.981 |
9.229 |
4.793 |
21.165 |
16.263 |
30,14 |
|
11 |
Hong Kong |
2.985 |
3.412 |
4.477 |
2.449 |
13.323 |
53.603 |
-75,15 |
|
12 |
New Zealand |
2.237 |
1.897 |
2.176 |
1.931 |
8.241 |
7.719 |
6,76 |
|
13 |
Italy |
779 |
1.502 |
1.910 |
3.149 |
7.340 |
4.704 |
56,04 |
|
14 |
South Africa |
835 |
1.888 |
851 |
2.073 |
5.647 |
2.580 |
118,88 |
|
15 |
Russia |
801 |
1.015 |
1.647 |
1.347 |
4.810 |
4.149 |
15,93 |
|
Total |
374.714 |
482.555 |
560.936 |
503.297 |
1.921.502 |
1.979.756 |
-2,94 |
|
|
Source: ITC |
||||||||